TUTORIAL - A web interface for the sensor data visualization
Table of contents
1. Introduction
2. Connecting to the web server
3. The main window
3.1 Window layout
3.2 Removing a graph
4. The settings dialog
4.1 Dialog layout
4.2 Sensor types
1. Introduction
The back-end system for the STEP2 tutorial provides a web interface for the sensor data visualization. By connecting to the designated URL from a web browser, user can monitor sensor readout values per type being plotted as real-time graphs.
2. Connecting to the web server
While the back-end system is up and running, connect to the following URL from a web browser on an observing PC. You can use your smartphone or tablet instead, of course.
http://<server_address>/
The server_address element of the URL, specified by IP address
or FQDN (Fully Qualified Domain Name), is for the host machine
which runs the container image for the back-end system.
If the port number of the web server is not using the standard 80,
specify the server_address as <address>:<port> format.
If you cannot connect to the web server even if the URL is correct,
it is likely to be a generic network problem.
Check for the end-end IP reachability (routing and firewall).
If you specify the server_address by FQDN, check if DNS works.
3. The main window
3.1 Window layout
The main window has a header and a body. The header contains the title and a settings button (gear icon). The body is constructed as a vertical list of graph cards per sensor type.
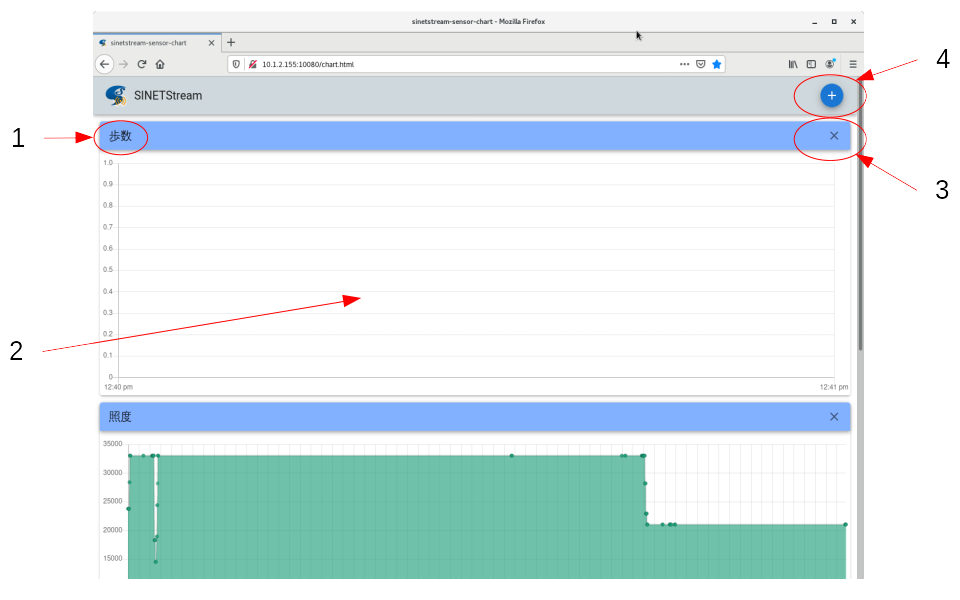
<Legends>
- Title
- Settings button (gear icon)
- Graph card per sensor type
- Close button (x) on each graph card
While the Android application “Sensor” is running, sensor readout
values are almost periodically published to the Broker, and then
processed by the back-end server to store them sequentially.
As long as the new sensor readout values are added in the database,
graph display region will be automatically updated.
In the main window, there are three graph display regions as the initial setup.
- light
- magnetic_field
- gravity
To adapt the available sensor implementations on the Android device, or to adapt the user-desired sensor types, user can change the displayed sensor types via the settings dialog. Press the settings button (gear icon) to open the settings dialog.
The modified window layout is saved in the local storage of your web browser. So if you restart the web browser and connect to the web server next time, saved layout is deployed.
3.2 Removing a graph
Press the close button (x) on the top-right corner of each graph card to remove the graph display region for that sensor type.
4. The settings dialog
4.1 Dialog layout
By pressing the settings button (gear icon) on the top-right corner of the main window, the settings dialog as shown below will pop up.
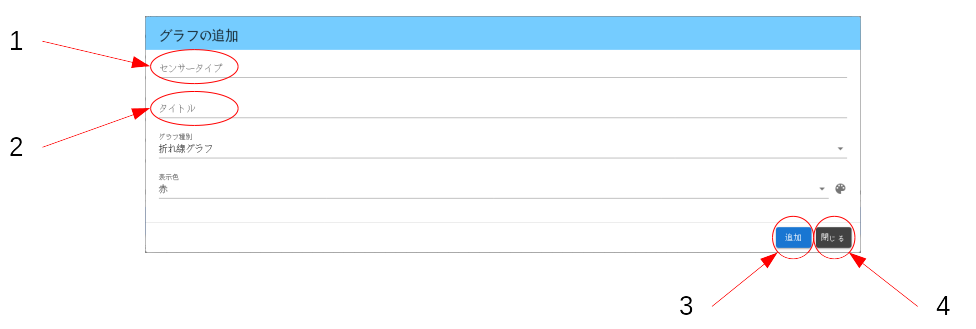
<Legends>
- Refresh Interval (seconds): Set the auto-refresh interval for graphs (default: 3 seconds).
- Max Display Range (minutes): Set the time span displayed on graphs (default: 60 minutes).
- Sensor type list: Select sensor types to display using checkboxes.
Select Allbutton: Enable all sensor types.Clear Allbutton: Disable all sensor types.OKbutton: Commit the settings and close this dialog.Closebutton: Cancel the edit work and close this dialog.
Turn on the checkboxes for the sensor types you want to display,
then press the OK button to commit.
You can cancel at any time by pressing the Close button.
4.2 Sensor types
Following is the list of sensor type available on this tutorial.
-
The 1st column
Typeand the 2nd columnSymbolcorresponds to the constants defined in the Android developer document Sensor. -
Watch the 3rd column
TypeNamein the table. This value (such likeaccelerometer) is the name shown in the sensor type list of the settings dialog. -
Note that available sensor types may vary depending on the hardware implementation or Android version of the device.
| Type | Symbol | TypeName |
|---|---|---|
| 1 | Sensor.TYPE_ACCELEROMETER | accelerometer |
| 2 | Sensor.TYPE_MAGNETIC_FIELD | magnetic_field |
| 4 | Sensor.TYPE_GYROSCOPE | gyroscope |
| 5 | Sensor.TYPE_LIGHT | light |
| 6 | Sensor.TYPE_PRESSURE | pressure |
| 8 | Sensor.TYPE_PROXIMITY | proximity |
| 9 | Sensor.TYPE_GRAVITY | gravity |
| 10 | Sensor.TYPE_LINEAR_ACCELERATION | linear_acceleration |
| 11 | Sensor.TYPE_ROTATION_VECTOR | rotation_vector |
| 14 | Sensor.TYPE_MAGNETIC_FIELD_UNCALIBRATED | magnetic_field_uncalibrated |
| 15 | Sensor.TYPE_GAME_ROTATION_VECTOR | game_rotation_vector |
| 16 | Sensor.TYPE_GYROSCOPE_UNCALIBRATED | gyroscope_uncalibrated |
| 17 | Sensor.TYPE_SIGNIFICANT_MOTION | significant_motion |
| 18 | Sensor.TYPE_STEP_DETECTOR | step_detector |
| 19 | Sensor.TYPE_STEP_COUNTER | step_counter |
| 20 | Sensor.TYPE_GEOMAGNETIC_ROTATION_VECTOR | geomagnetic_rotation_vector |
| 35 | Sensor.TYPE_ACCELEROMETER_UNCALIBRATED | accelerometer_uncalibrated |